
Geneva 25 January 2016 — The World Meteorological Organization has confirmed that the global average surface temperature in 2015 broke all previous records by a strikingly wide margin, at 0.76° Celsius above the 1961-1990 average. For the first time ever, temperatures in 2015 were about 1°C above the pre-industrial era.
The consolidated WMO analysis combines three internationally-renowned observational datasets with those from sophisticated reanalysis systems. As such it provides the most authoritative international reference source.
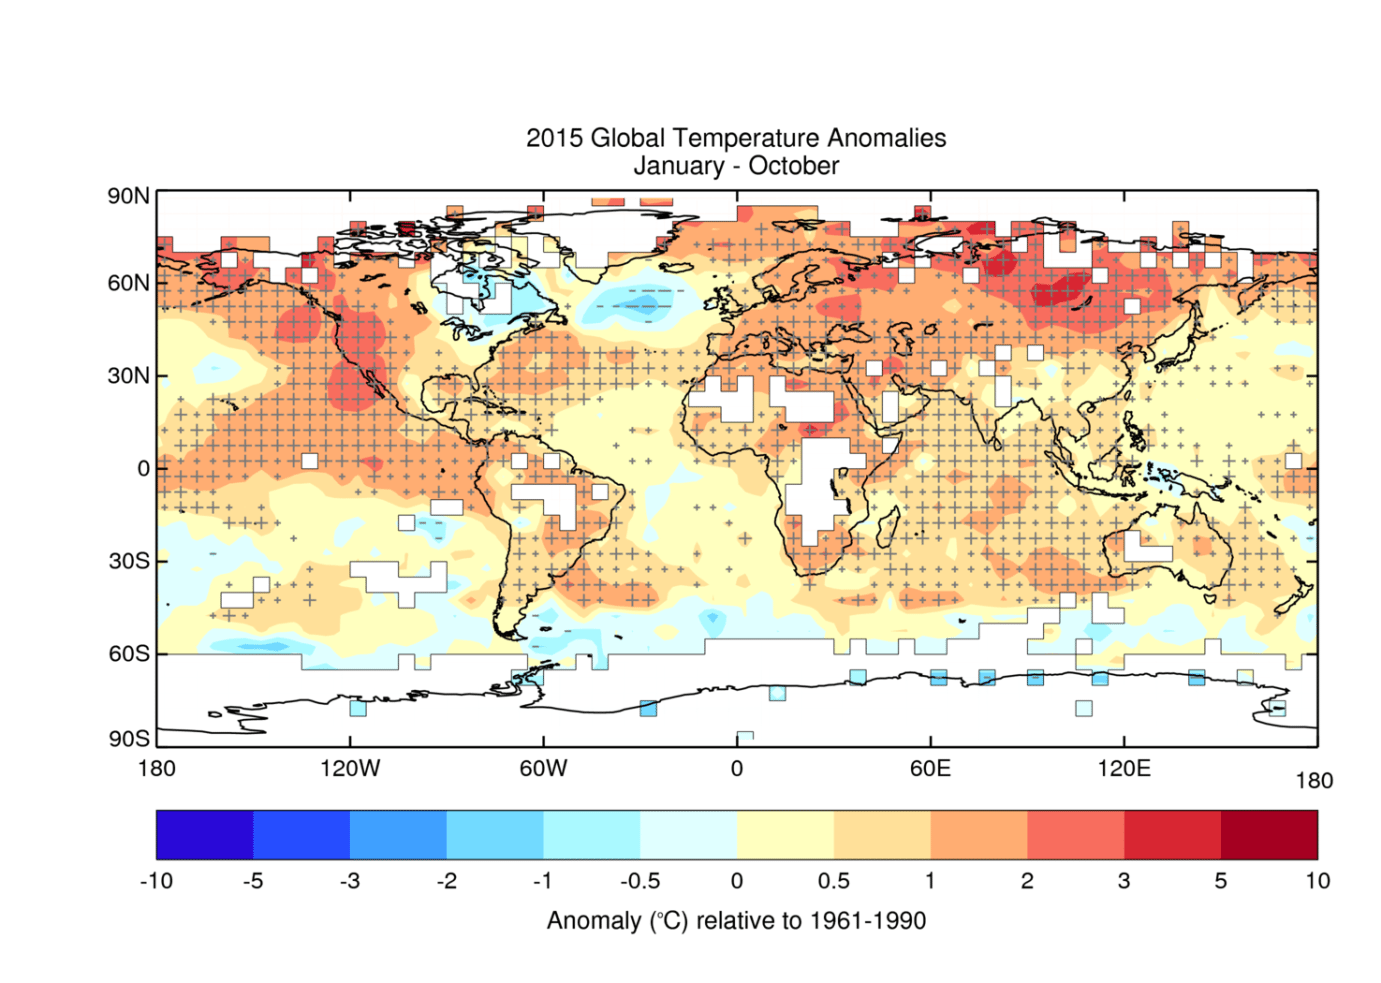
Figure 1: Average temperature anomalies for January to October 2015 from the HadCRUT.4.4.0.0 data set. Crosses (+) indicate temperatures that exceed the 90th percentile, signifying unusual warmth, and dashes (-) indicate temperatures below the 10th percentile, indicating unusually cold conditions. Large crosses and large dashes indicate temperatures outside the range of the 2nd to 98th percentiles. Source: Met Office Hadley Centre.
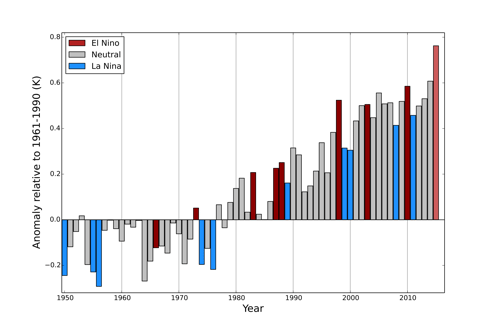
Fifteen of the 16 hottest years on record have all been this century, with 2015 being significantly warmer than the record-level temperatures seen in 2014. Underlining the long-term trend, 2011-15 is the warmest five-year period on record.
The record temperatures over both land and the ocean surface in 2015 were accompanied by many extreme weather events such as heatwaves, flooding and severe drought.
“An exceptionally strong El Niño and global warming caused by greenhouse gases joined forces with dramatic effect on the climate system in 2015,” said WMO Secretary-General Petteri Taalas. “The power of El Niño will fade in the coming months but the impacts of human-induced climate change will be with us for many decades.”
“We have reached for the first time the threshold of 1°C above pre-industrial temperatures. It is a sobering moment in the history of our planet, ” said Mr Taalas. ” If the commitments made during the climate change negotiations in Paris and furthermore a higher emission reduction ambition level is reached, we still have chance to stay within the maximum 2°C limit,” said Mr Taalas.
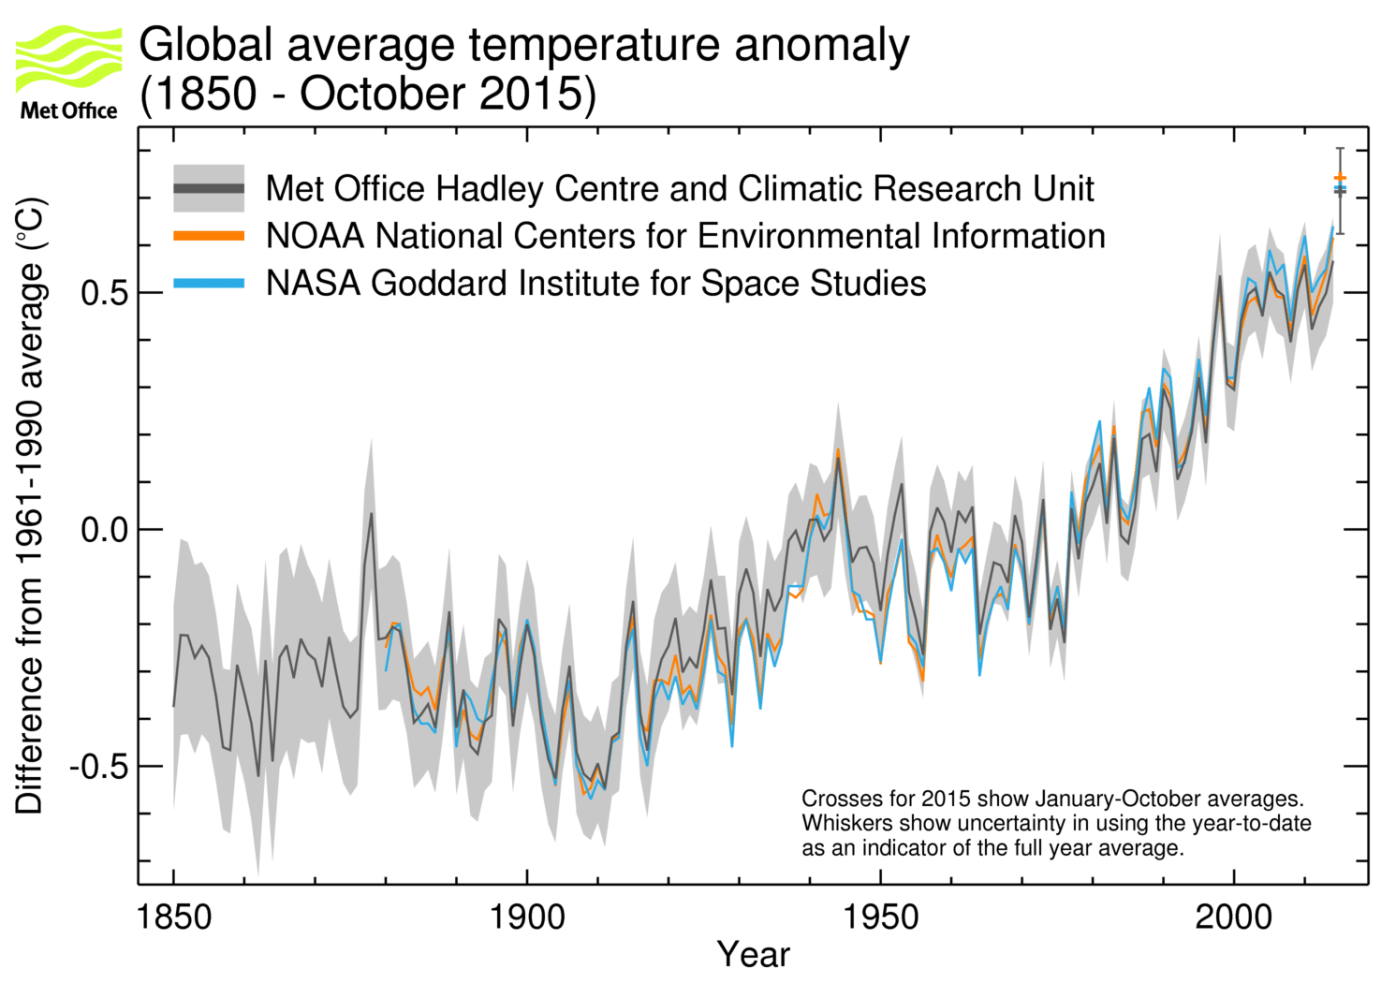
Figure 2: Global annual average near-surface temperature anomalies from HadCRUT4.4.0.0 (Black line and grey area indicating the 95% uncertainty range), GISTEMP (blue) and NOAAGlobalTemp (orange). The average for 2015 is a provisional figure based on the months January to October 2015. Source: Met Office Hadley Centre.
“Climate change will have increasingly negative impacts for at least the next five decades. This emphasizes the need to invest in adaptation besides mitigation. It is important to strengthen the capability of countries to provide better disaster early warnings to minimize human and economic losses. Climate change increases the risk of weather related disasters which are an obstacle to sustainable development,” he said.
The WMO global temperature figure is principally derived from datasets maintained by the Hadley Centre of the UK’s Met Office and the Climatic Research Unit, University of East Anglia, United Kingdom (HadCRUT4); the US National Oceanic and Atmospheric Administration (NOAA) National Centers for Environmental Information; and the Goddard Institute of Space Studies (GISS) operated by the National Aeronautics and Space Administration (NASA). The WMO also draws on information from reanalysis systems, which use a weather forecasting system to combine many sources of data to provide a more complete picture of global temperatures, including in Polar regions. WMO takes data from the reanalyses produced by the European Centre for Medium-Range Weather Forecasts.
The HadCRUT4, NOAA and NASA datasets all showed that 2015 was the warmest year, as did the ECMWF reanalysis.
WMO uses 1961-1990 as the internationally agreed base period for measuring long-term climate change. The average global temperature during that period was 14°C.
The global temperature data set of the UK’s Met Office goes back to 1850, and those of NOAA and NASA to 1880.
WMO will issue its full Statement on the Status of the Global Climate in 2015 in March, with comprehensive details of regional trends, extreme events, sea ice, sea level rise and tropical cyclones. WMO’s provisional Statement on the Status of the Global Climate in 2015 and for the 2011-2015 five year period is available here.

Figure 4: Ocean heat content down to a depth of 700m (left) and 2000m (right). Three-month (red), annual (black) and 5-year (blue) averages are shown. Source: NOAA NCEI
The World Meteorological Organization is the United Nations System’s authoritative voice on Weather, Climate and Water